It has been almost a year of me switching constantly between working on Tableau and JavaScript. Recently I realized Tableau had the capability of using JS along with it from a long time. It enables to Tableau to handle more custom use cases and cover up the limitations. Since it has two types of JS APIs, it created a lot of confusion between when to use what, the capability of each API and use cases that they can handle. Since I could not find a proper article that explains both of them together, I decided to make notes for my future self through this post.
TLDR; There are two types of official JS APIs from Tableau. (1) Tableau JS API allows to incorporate and interact with Tableau Dashboards in other web applications, whereas (2) Tableau Extension API allows building JS-based applications that can be added into Tableau Dashboards on Server and Desktop also enabling interactions with worksheets that dashboard has.
Tableau JS API
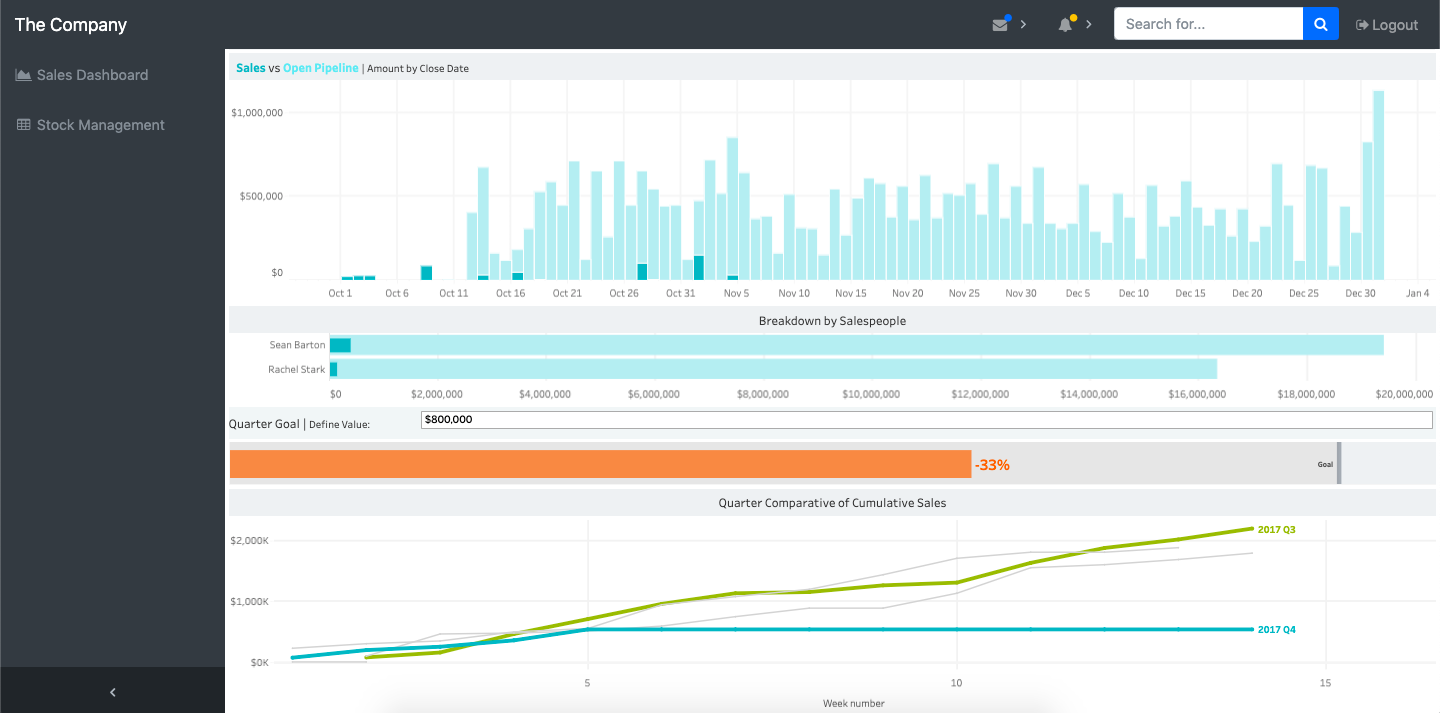
Say your company already has a web application for stock management and only sales data is visualized using Tableau, it is not a good UX to ask users to visit two separate web pages. This is the perfect use case for Tableau JS API. It helps to embed existing Tableau Dashboards into web applications. Unlike just putting the published Dashboard in an iframe, the JS API lets you get event-based triggers and data from the dashboard to the web application which gives the native feel to the users. Along with that, if the data needs to be filtered according to the user role, you can pass that to Tableau Dashboard to filter the data that he has to see.

The capabilities don't end here, dashboards can be embedded into web apps built using new-gen frameworks like React, Angular and Vue. This not just makes the user experience better, the JS API can also help you fetch data from the dashboard to make other operation in the web app like updating the source data, performing actions based on the outcome from the data, etc. Another interesting thing about embedding is that you can write custom CSS to override the styles of the embedded the dashboards without worrying about styling in Tableau Desktop.
If you are planning to work with similar use cases as we discussed, you can head over to Tableau JavaScript API Usage Guide to get started.
Tableau Dashboard Extensions API
At a data-driven Organization, chances are that the users are more comfortable to use the dashboards from the Tableau Server itself. But let's admit it, no matter how good Tableau is, it has its limitations when comes to certain technical/business needs. To bring the capabilities of the JS API without asking the users to embed the dashboards, Tableau launched Dashboard Extensions API. This API helps you develop small web apps that go into Dashboards published on Tableau Server.
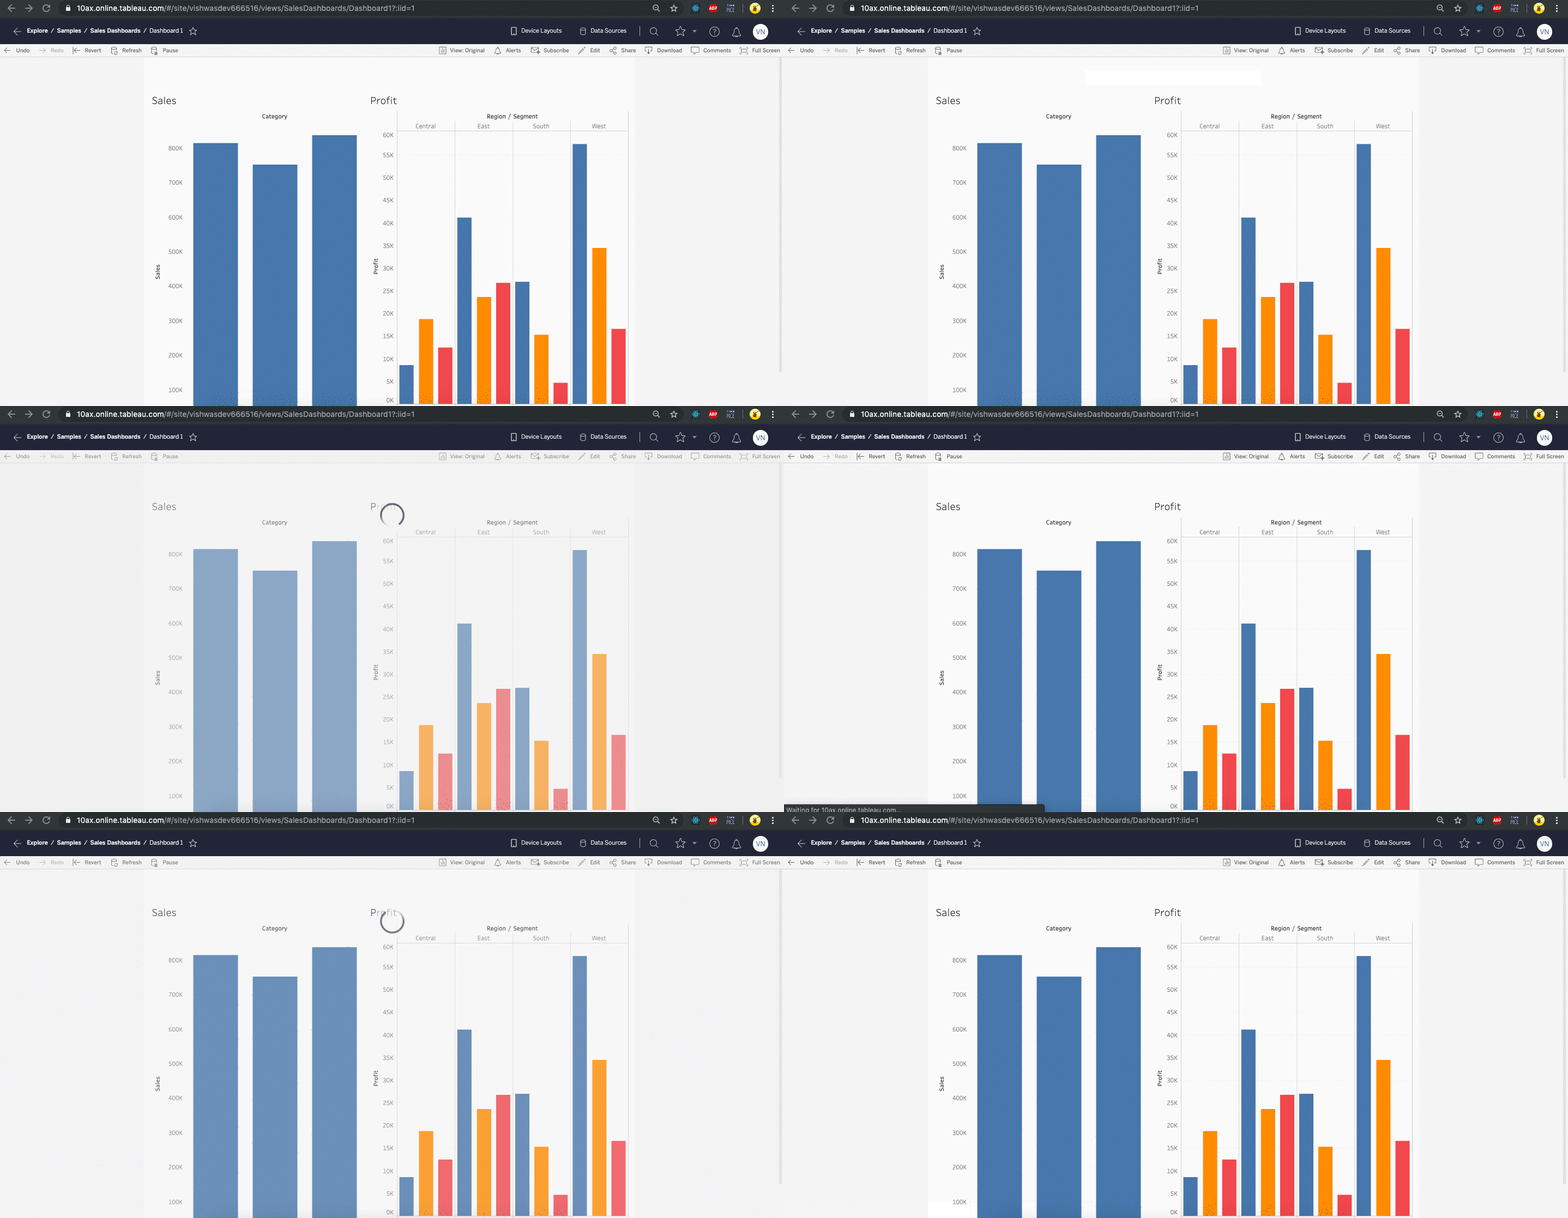
One limitation that is been discussed a lot in every Tableau Community is to refresh the data in a dashboard that connects to live data source without having to hit the refresh button on the dashboard or in the browser. If you have your dashboard displayed in a large display at the office, you can't ask someone to refresh the data on regular intervals. Also, refreshing the page loads everything in the page, again and again, eating up the bandwidth. Instead, we just need to fetch the latest data and update what might have changed.
This can be achieved with just 20 lines of JS used as Extension in the Dashboard, which simply fetches the data sources that all sheets in the dashboards and pulls the latest data. Source code for the auto-refresh extension can be found in my Github repo.

NOTE: In case you have a large SQL query that is connected Live to Dashboard, refreshing it every 5 seconds might overload the DB server and slow down the reports. Use extracts and refreshes appropriately.
Other use cases for Extension API
- Running Machine Learning Algorithms on the dashboard data to provide more meaning full insights together.
- Using powerful chart libraries like d3.js to generate the graphs that are not yet supported by Tableau.
- Making Tableau Dashboard full-fledged application by giving it abilities to change underlying data, send actions and data to different API, etc.
- Creating custom filters and parameters specific to business usage.